I eat cabbage, and the boss eats meat. On average we eat cabbage rolls.
Folk wisdom
The world continues to increase its income. According to forecasts of international organizations, in 2018 the economy will grow by 3.1% (World Bank) or 3.8% (OECD), or even 3.9% (IMF). Does this mean that all countries, their residents and each of us personally are becoming richer? Definitely no: the well-being of representatives of the rich strata increases, but the majority of the poor remain poor. We will try to reveal various aspects of the growth of social inequality and per capita income in the world in 2018.
The increase in billionaire wealth exceeds the growth rate of the global economy
Forbes is a fascinating magazine that we turn to when we want to know the names of the world's richest people and the size of their wealth. His 2018 list features a record number 2208 billionaires from 72 countries and territories. This elite the group owns $9.1 trillion, up 18% from last year, Forbes notes.
So, the increase in the welfare of the richest people on the planet by 2018 was compared to 2017 18% . And according to the IMF forecast, the growth of the world economy in 2018 is 3,9% . Thus, the rate at which billionaires are getting rich exceeds the rate at which the world economy is growing, which means that the rest of the economy is growing slower than the “hospital average.” .
10 richest and poorest countries in the world
Let's analyze the stratification of the world's countries into rich and poor. We will not consider the total wealth that countries have (because there are very large but very poor countries whose gross domestic product (GDP) is greater than that of very small but rich countries), but the relationship between the wealth of each country and its population, that is GDP per capita.
Based on IMF statistics, we will compile Table 1, from which you can see how the composition and income of the richest and poorest countries in the world have changed over the past 10 years.
Table 1 - The richest and poorest countries in the world
in terms of GDP per capita
| The mostrich countries* | The mostpoor countries* | GDP per capita, thousand US dollars | |||||
| 2007 | 2017 | 2018** | 2007 | 2017 | 2018** | ||
| Luxembourg | 107 | 106 | 120 | South Sudan | – | 0,228 | 0,246 |
| Switzerland* | – | 81 | 87 | Burundi | 0,170 | 0,312 | 0,340 |
| Iceland* | – | – | 85 | Ethiopia | 0,249 | – | – |
| Macau SAR | – | 77 | 84 | Congo | 0,254 | – | – |
| Norway | 85 | 75 | 83 | Eritrea | 0,279 | – | – |
| Ireland* | – | 71 | 81 | Malawi | 0,307 | 0,324 | 0,342 |
| Iceland | – | 70 | – | Niger | 0,313 | – | – |
| Qatar | 69 | 61 | 66 | Afghanistan | 0,325 | – | – |
| Switzerland | 64 | – | – | Sierra Leone | 0,369 | – | – |
| Ireland | 61 | – | – | Madagascar | 0,379 | – | – |
| Singapore | – | 58 | – | Central African Republic | – | 0,386 | 0,426 |
| USA | – | 59 | – | Nepal | 0,394 | – | – |
| Denmark | 59 | 56 | 64 | Yemen* | – | – | 0,449 |
| Sweden | 53 | – | – | Mozambique | – | 0,429 | 0,472 |
| Netherlands | 51 | – | – | Niger* | – | 0,440 | – |
| Great Britain | 50 | – | – | Madagascar* | – | 0,448 | 0,479 |
| USA* | – | – | 62 | Congo* | – | 0,478 | 0,478 |
| Singapore* | – | – | 62 | Gambia | – | 0,480 | 0,500 |
| Sierra Leone* | – | 0,491 | 0,505 | ||||
| Yemen | – | 0,551 | – | ||||
** – for 2018 the forecast is presented based on actual data for 5 months
If we assume that in each of the countries presented in Table 1 there is one average citizen, whose per capita GDP accounts for the corresponding volume, then we can estimate the average growth rates of population incomes for two groups of countries (the richest and the poorest), as well as the dynamics of these indicators (table 2).
Table 2 - Characteristics of groups of the richest and poorest countries in the world
Per capita income growth in absolute terms (in thousands of US dollars) continues in 2018 for both rich and poor countries. But the ratio of average GDP per capita by group of countries (rich to poor), as well as the richest to the poorest country, increased in 2018. It says on the growing income gap between groups in rich and poor countries in 2018 .
What about our income inequality indexes?
Ukraine is modestly represented in the Forbes list in 2018 7 the country's richest billionaires with a total fortune $13.2 billion, about 13% of the country's annual GDP. Let’s add to this group of hryvnia millionaires, of whom, according to the State Fiscal Service of Ukraine, by 2018 there were 4,063 people in the country with more than $1 billion in annual income.
As for the income inequality indices calculated by the World Bank, according to the latest study, Ukraine is indeed ahead of the rest. The value of the Ukrainian Gini index (about 25%) and the Palma coefficient (8.2%) is the best in Europe.
This begs a logical question: how is this possible? Experts explain this phenomenon by the high volume of the shadow economy and the low quality of per capita income statistics taken into account when calculating inequality indices. But optimists reassure: not everything is so bad, and we still have a chance to get into the club of countries with the lowest level of social inequality, just... from a different entrance. They say that we have our own, unique path of development, and if it doesn’t work out like everyone else, then we will definitely succeed in our own way.
A professional information and news resource dedicated to non-resident companies, offshore business, taxation, international banking, online business, startups and innovation. You will find this and many other interesting things in our articles and news. Do not forget to look at our directory of enterprises of the above types of activities.
If you take an interest in world events, you have undoubtedly noticed the continued strengthening of China's economy. When economists evaluate the economy of any country, they refer to GDP (gross domestic product), which is the sum of all economic activities of the country. This is not an ideal way to measure real economic growth, but it is suitable for quickly analyzing the economic situation.
When determining the economic level, GDP per capita is a better tool than just GDP. To actually provide ratings, GDP per capita is adjusted for purchasing power parity (PPP), a concept in economics used to determine relative values between currencies.
Here are the 10 countries with the highest GDP per capita, adjusted for PPP, as determined by the International Monetary Fund (IMF).
10. Australia - GDP per capita: $43,073

Australia is a member of the Commonwealth, one of the countries with the highest average standard of living, and has recently developed significant economic relationships with China and with other growing economies in Asia. The main factor driving the growth of Australia's economy is the production of goods, driven by the manufacturing industry.
9. Canada - GDP per capita: $43,427

The New York Times, in an article about the middle classes in Canada and the United States, noted that for the first time, the middle class of the Canadian population is better off than the middle class in the United States.
Over the past decade, the ranking of one of the most peaceful countries has increased. A growing economy based on rising commodity prices in the market, as well as a developing financial industry, have made Canadians much more prosperous.
8. San Marino - GDP per capita: $44,480

The tiny country of San Marino is also one of the richest per capita in the world. San Marino, surrounded on all sides by Italian territory, is the oldest sovereign state in the world, as the current political system is a direct successor to the system formed in 301 AD.
San Marino has no public debt, one of the lowest unemployment rates in Europe, thanks to a highly developed financial industry and tourism. For 32,000 citizens, these industries provide sufficient welfare.
7. Switzerland - GDP per capita $46,430

Switzerland, known as the producer of the most delicious and expensive chocolates, has a long history and remains neutral in all international issues - it even joined the UN only in 2002.
Not only manufacturing, science and technology, but also the financial sector are well developed in the country, so Switzerland has become the economic center of the world. The neutrality maintained for a long time attracted not only the headquarters of transnational corporations (Nestle, etc.) to the country, but also such non-profit organizations as the Red Cross. Switzerland will likely lead the European economy for a long time to come.
6. USA - GDP per capita: $53,101

Although the economy looks strong on a per capita basis, the widening wealth gap makes very few (less than 1%) people actually wealthy. Yet the United States middle class is better off than in many countries.
5. Brunei - GDP per capita: $53,431

Brunei is a little-known small country. A former British colony, the sovereign state is located on the island of Borneo, sharing it with Malaysia and Indonesia. Thanks to large oil fields, Brunei has become a very rich country. Brunei is one of only two countries in the world that has no government debt. 90% of Brunei's GDP is based on crude oil sales, so the future of the country's economy will depend on oil prices.
4. Norway - GDP per capita: $54,947

Unlike Brunei, Norway is a country with large oil reserves, but at the same time it is a country with a mixed economy. 57% of GDP is made up of gas and crude oil. Oil reserves contribute to a sovereign wealth fund that has made, at least on paper, every Norwegian a millionaire. Of course, individual citizens do not have access to this money, but it is money that has made Norway the most stable state in the modern world.
3. Singapore - GDP per capita: $64,584

Singapore, an island state in Asia, is known as one of the most important and largest port cities in the world. Singapore is Asia's commercial hub for shipping and transportation, but could, like Hong Kong before, become a key city in the financial industry.
There is little original vegetation left for the highly developed city of 5.4 million. The importance of the Port of Singapore, and its status as a tax haven for the ultra-rich, means that Singapore will become richer every year.
2. Luxembourg - GDP per capita: $78,670

Luxembourg, like Switzerland, has economy based on steel and chemicals. To compensate for losses after the departure of many industries to Asian countries, it well developed banking and other financial services. Beneficial taxes have attracted the headquarters of various transnational corporations here, especially Internet startups ( Amazon, Skype). Luxembourg is on track to become even richer, so its small population (537,853) will have no problems.
1. Qatar - GDP per capita: $98,814

Qatar is a monarchy ruled by the Al Thani family. It is famous for its sovereign wealth fund, which, among other things, allows it to buy up football teams and airlines around the world. Like many states, this fund is based on oil, the reserves of which put Qatar in third place in the world.
Although its population is 1.8 million people, only 280,000 of them are citizens of the country. The rest, migrants, who are not included in the calculations, act as a lower class of workers, not receiving any benefits from the national wealth. But for the lucky 280,000, Qatar is the richest country in the world.
Do you want to know which countries' people are the happiest? See TOP 5 HAPPIEST COUNTRIES IN THE WORLD. The happiness index includes the well-being of the people and the state of the environment.
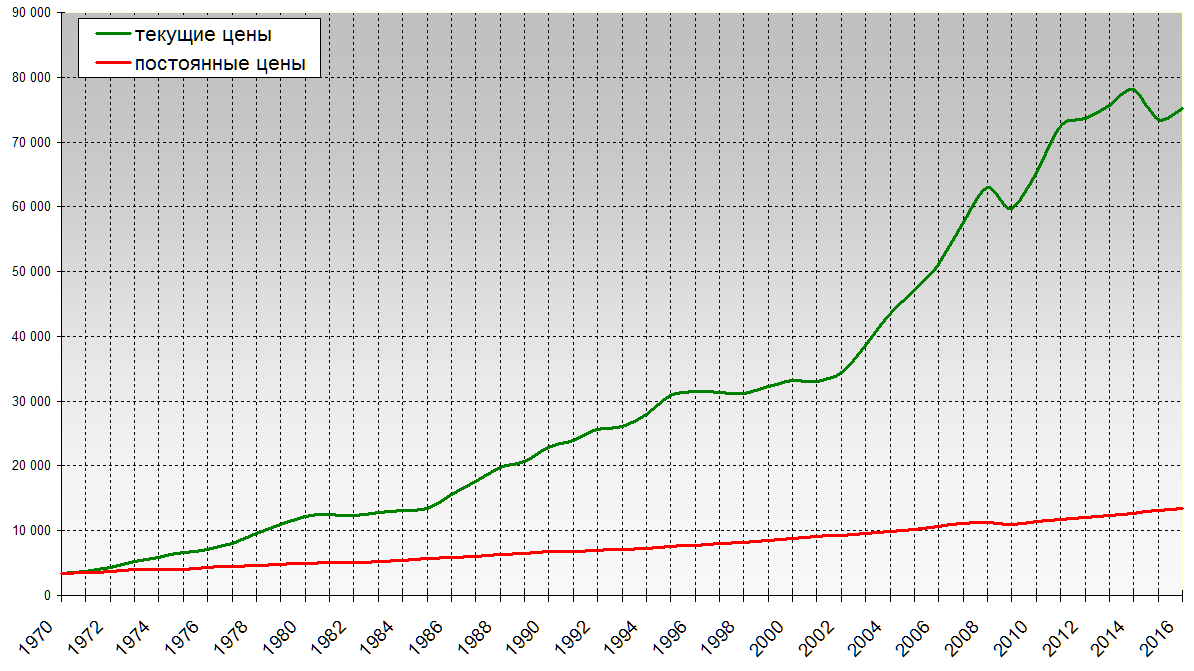
How the world's GDP changed from 1970 to 2016 in nominal and constant prices relative to 1970. You can read this and much other interesting information in this article. Where there is no data for 2016, data for 2013 is provided and there is a mention of this.
For the period 1970-2016. World GDP increased from 3398.7 to 75212.7 and increased by 71817 billion US dollars or 22.13 times; the change occurred due to an increase in the world population from 3692 to 7456 million people, i.e. the population grew by 3764 million people. or 2.02 times relative to 1970. It also grew due to an increase in GDP per capita in the world, which in 1970 was $921, and already in 2016 it was $10,167. The average annual growth of the world's GDP during this period amounted to 1561.2 billion dollars.
During 1970-2016 World GDP per capita increased by $9,246 or 11.04 times to $10,167. The average annual increase in GDP per capita in the world during this period was $201 per year.
In constant prices by 1970 the picture looks like this. Here it should be said what constant prices are.
Constant prices: A common set of prices used to estimate the output of a firm or an economy as a whole over successive periods. Changes in the real output of a business or economy are measured by estimating the value of annual real inputs and output at constant prices. Constant prices are prices for a specific date or average prices for a period. It is quite difficult to identify an appropriate set of constant prices, since the type and quality of goods are constantly changing. It is impossible to find out the price of a product in 1980 if this product went on sale only in 1990, or, conversely, the price of a product in 1990 if its sale was discontinued in 1980. The longer the period under consideration, the greater the share of the total volume of production, in estimating the value of which one has to face difficulties of this kind, and the less reliable are comparisons of income or output at constant prices.
So, constant GDP relative to 1970 prices increased from 3398.7 billion dollars. $ to 13487.4 billion dollars. $ in 2016. The growth amounted to 10,088.7 billion dollars. $ or it increased by 3.97 times.
World GDP per capita in constant prices relative to 1970 increased from $921 to $1,823 in 2016. The increase was $902, or it increased by 1.98 times. This means that the purchasing power of one inhabitant of the planet has almost doubled in 46 years.

Nominal world GDP, billion dollars, 1970-2016
Nominal GDP per capita in the world, dollars, 1970-2016, current prices


GDP nominal in the world by region
Share of regions in nominal world GDP, %, 2013

TOP 30 countries by world GDP 1970-2016 (nominal / PPP)
Leading countries in GDP par value of the world 1970-2016
An economic indicator such as GDP per capita is often used to assess the economic condition of a country. Everyone knows about the existence of GDP. People often hear this term in economic news. But, unfortunately, not everyone knows what it is.
GDP is gross domestic product. To put it in simple words, then GDP is an indicator of the value of goods and services produced by a particular state. These are all products and services produced in the state, which are expressed in monetary terms. This indicator is often expressed in US dollars due to the fact that the US dollar is one of the most stable currencies in the world.
Today there are two types of GDP:
- Nominal is the total volume of products and services produced, measured in current prices, that is, in values that are relevant today.
- Real GDP is the total volume of goods and services produced over a certain period of time, measured in basic values. Basic costs are called constant prices.
The difference between nominal and real GDP is that real GDP can only be affected by changes in the volume of goods produced. While changes in nominal GDP are directly affected by the price of products and services sold.
The ratio of the nominal to the real indicator in the economy is called the GDP deflator.
In other words, the deflator is an indicator of the difference in the general level of values in an economic sector.
We divide the total volume of GDP by the number of citizens living in the state.
The most developed states
The most developed countries in the world in 2018-2019, according to the ranking of countries, were the following states:

America entered the ranking of countries with the highest GDP thanks to corporations such as Microsoft and Google. Every year in America there is a growth of the country's GDP of 2.2%. The figure per person is $55,000.
- with a GDP of 11.2119 trillion US dollars. China does not leave its position and still remains one of the most leading economies in the world. According to the forecasts of economists and financial analysts, China has every opportunity to soon displace the United States of America. This is possible thanks to the intensive growth of GDP. The share of China's GDP is growing by 10% annually.
- Takes third place. Despite the fact that economists predict a partial slowdown in Japanese growth, this country today has a GDP of $4.2104 trillion.
According to statistics, the share of this republic's GDP increases by 1.5%. The increase in indicators is due to the established export of cars, household appliances, computers and other electronic goods. This country has a per capita GDP of $39,000.

- It ranks fourth with a GDP level of 3413.5 trillion US dollars per year. The country was able to achieve such indicators thanks to the export of Volkswagen cars, industrial equipment and household appliances. Compared to the previous year, the share of gross domestic product in Germany increased by 0.4%. GDP per capita is US$46,000.
- The last place in the top 5 developed countries of the world was taken by. The level of the indicator at around 2853.4 trillion dollars allowed Great Britain to displace France.
List of developed countries
Below are the top 20 largest countries in the world, which took leading positions in terms of GDP after the five most developed countries on the planet.
| The name of the country | GDP (expressed in billions of US dollars) |
| France | 2464.8 |
| India | 2288.7 |
| Italy | 1848.7 |
| Brazil | 1534.8 |
| Canada | 1462.3 |
| South Korea | 1321.2 |
| Spain | 1242.4 |
| Australia | 1200.8 |
| Russia | 1132.7 |
| Mexico | 1082.4 |
| Indonesia | 937.0 |
| Netherlands | 762.5 |
| Türkiye | 751.2 |
| Switzerland | 651.8 |
| Saudi Arabia | 618.3 |
| Nigeria | 538.0 |
| Sweden | 512.6 |
| Taiwan | 508.8 |
| Poland | 473.5 |
| Belgium | 465.2 |
Indicators in EU countries
The European Union is a very powerful and unique economic structure. In 2019.
World GDP for 2018
Top 10 most economically developed countries of the European Union (2018 statistics):
- The most developed country in the world, part of the European Union, is Liechtenstein. Despite its small area, the country has an incredibly strong economy, as evidenced by its per capita GDP of €85,400 in 2016.
- Second place goes to the Netherlands. This country has a GDP per capita of 42,400 euros.
- Ireland ranks third. The GDP per capita is 40,000 euros.
- In Austria, the GDP per capita is 39,700 euros.
- Sweden has an indicator of 38,900 euros.
- In Germany, the gross domestic product is 38,800 euros.
- According to statistics in Finland, the GDP level is 38,100 euros.
- Eighth place is occupied by Italy with a GDP of 35,800 euros.
- The UK is experiencing a GDP growth rate. In 2015, this figure was 34,600 euros.
- Tenth place is occupied by Spain with an indicator of 33,700 euros.
Table: GDP level of European countries that are members of the EU
| Republic name | GDP per person (expressed in euros) |
| Denmark | 31 500 |
| Cyprus | 30 700 |
| Belgium | 28 100 |
| Slovakia | 26 100 |
| Slovenia | 25 300 |
| France | 25 800 |
| Portugal | 24 900 |
| Hungary | 24 500 |
| Poland | 24 400 |
| Greece | 23 600 |
| Estonia | 22 900 |
| Czech | 19 800 |
| Romania | 19 700 |
| Lithuania | 18 000 |
| Latvia | 16 700 |
| Bulgaria | 15 800 |
| Malta | 14 600 |
| Croatia | 12 600 |
The "weakest" states
Forex technical analysis economists conducted research on the forecast for GDP growth and decline for 2019. According to the findings, the list of countries with weak economies in 2019 will consist of the following states:

Forecast of the dynamics of GDP growth in other countries of the world
Table: list of countries whose GDP levels are expected to increase in 2019
| Republic name | Expected growth (expressed in %) | Probability of an economic crisis (expressed in %) |
| India | 7.4 | 0 |
| Vietnam | 6.6 | 0 |
| China | 6.5 | 12 |
| Sri Lanka | 6.4 | 0 |
| Philippines | 6.0 | 5 |
| Dominican Republic | 5.4 | 0 |
| Indonesia | 5.2 | 10 |
| Malaysia | 4.5 | 10 |
| Bolivia | 3.9 | 20 |
| Peru | 3.8 | 10 |
| Romania | 3.8 | 10 |
| Poland | 3.5 | 5 |
| Albania | 3.5 | 0 |
| Slovakia | 3.3 | 8 |
| Thailand | 3.2 | 5 |
| Iceland | 3.1 | 0 |
| Türkiye | 3.0 | 20 |
| Bosnia | 3.0 | 0 |
| South Korea | 2.9 | 18 |
| Colombia | 2.8 | 8 |
| Mexico | 2.8 | 10 |
| Sweden | 2.8 | 10 |
| Spain | 2.7 | 5 |
| Czech | 2.7 | 10 |
| Australia | 2.6 | 15 |
| Bulgaria | 2.5 | 10 |
| USA | 2.5 | 15 |
| Armenia | 2.5 | 0 |
| Hungary | 2.4 | 0 |
| New Zealand | 2.3 | 13 |
| Great Britain | 2.3 | 13 |
| Uruguay | 2.0 | 25 |
| Kazakhstan | 2.0 | 33 |
| Taiwan | 2.0 | 55 |
| Germany | 1.8 | 8 |
| Canada | 1.8 | 25 |
| Serbia | 1.6 | 18 |
| France | 1.4 | 10 |
| Norway | 1.4 | 15 |
| Ukraine | 1.4 | 60 |
| South Africa | 1.4 | 25 |
| Italy | 1.3 | 13 |
| Denmark | 1.9 | 0 |
| Kuwait | 1.9 | 0 |
| Chile | 2.3 | 5 |
| Azerbaijan | 2.4 | 0 |
In the EU countries, GDP levels are expected to increase by 1.7%. The probability of a recession is 15%.
- China.
- Rwanda. This country is focused on the export of minerals, coffee, tea. Although the state's economy is growing, it is still one of the poorest in the world.
- Tanzania. Tanzania's main export is gold.
- Mozambique. This country exports coal and natural gas around the world.
- Butane. The republic's economy is growing thanks to the development of agriculture and forestry.
- India.
- New Guinea. Export: gold, copper, oil, agricultural products.
- Cote d'Ivoire. The country is one of the largest exporters of cocoa beans, agricultural products, coffee and palm oil.
- Uzbekistan. Products: cotton, natural gas, gold.
- Burma.
- DR Congo.
- Turkmenistan. This state exports cotton and natural gas.
- Ethiopia. Export products: textile industry, electricity, agricultural products.
| The name of the country | GDP growth in 2018 (expressed as %) | Forecast of GDP growth in 2018 (expressed in %) |
| China | 7.00 | 6.90 |
| Rwanda | 7.00 | 7.50 |
| Tanzania | 7.10 | 7.10 |
| Mozambique | 7.30 | 7.30 |
| Butane | 8.40 | 7.00 |
| India | 7.80 | 8.00 |
| New Guinea | 5.00 | 2.40 |
| Ivory Coast | 7.70 | 7.50 |
| Uzbekistan | 7.80 | 8.00 |
| Burma | 8.20 | 8.00 |
| DR Congo | 8.50 | 9.00 |
| Turkmenistan | 9.00 | 9.00 |
| Ethiopia | 10.50 | 8.50 |
GDP or the gross domestic product of a state is a macroeconomic coefficient that determines the ability of the national economy to produce services and goods over the past year in various areas of the economy in order to consume and export.
That is, GDP is a consequence of the economic activities of enterprises and other institutions in the country, regardless of citizenship and state affiliation.
The state's GDP per capita is a coefficient that characterizes the economic condition and development of the state. Gross domestic product is the ratio of GDP to population in a country.
GDP indicators characterize, first of all, indicators of the standard of living of the population.
On video - US GDP:
United States of America
The US economy has maintained its leading position for 100 years. But, unfortunately, the country has a large gap between the rich and the poor.
The US has a high GDP due to the presence of natural resources.
The USA is the largest exporter in the world.
The main industries of the country are the oil industry, automobile manufacturing and production occurs thanks to high technology.
The USA also produces cars, gasoline, steel, chemical products, and electronics.
But, unfortunately, the United States is now gradually beginning to lose its leading position, and the rapidly developing economy of China may supplant it.
Less than 25% of world production is concentrated in the United States, and previously it was about 50%. The country's exports and imports fall on countries such as Canada, Mexico, Japan, China and European countries.
Now the United States has a large public debt, which significantly affects the development of the country's economy. At the moment, the US debt is approximately $19.3 trillion.
For those who want to know how to get it, it is worth reading the contents of this article.
However, US GDP growth is still the highest in the world.
The US has a large number of jobs and a low unemployment rate, which has fallen for the first time in several years. Lower energy prices also allow consumers to add more money to invest in other goods and services. There is an increase in wages and, accordingly, consumer spending.
A low price level in the state will lead to lower prices for foreign goods and strengthen the position of the dollar.
But you can find out how to get a tourist visa to the USA if you read the contents of this
On video - Russia's GDP:
Russia
A decline in oil prices could significantly reduce Russia's GDP, leading to a deterioration in the economy. Current sanctions and geopolitical tensions also have a negative impact on the economy.
Real incomes continue to fall.
GDP per capita may decline to $11.9 thousand; this situation is observed due to the deterioration of the economy due to the 2015 crisis and currency devaluation.
The economy is negatively affected by factors such as slower growth in labor productivity, high taxes, which amount to 35% of GDP - this indicator characterizes the state as developed with high incomes.
The structure of the Russian economy is dominated by the sector providing various services, as well as the food industry, chemical production, metallurgy, and production of machinery and equipment.
The strongest industries are the extraction of fuel and energy minerals, as well as the production of electrical equipment and many others.
In order to improve the economic condition of the state, it is necessary to reduce the tax burden, invest in economic development and increase labor productivity.
The reasons for low economic indicators are geographical location, historical features, shortage of minerals, interethnic conflicts, and wars. The main cause of poverty in countries is political instability.